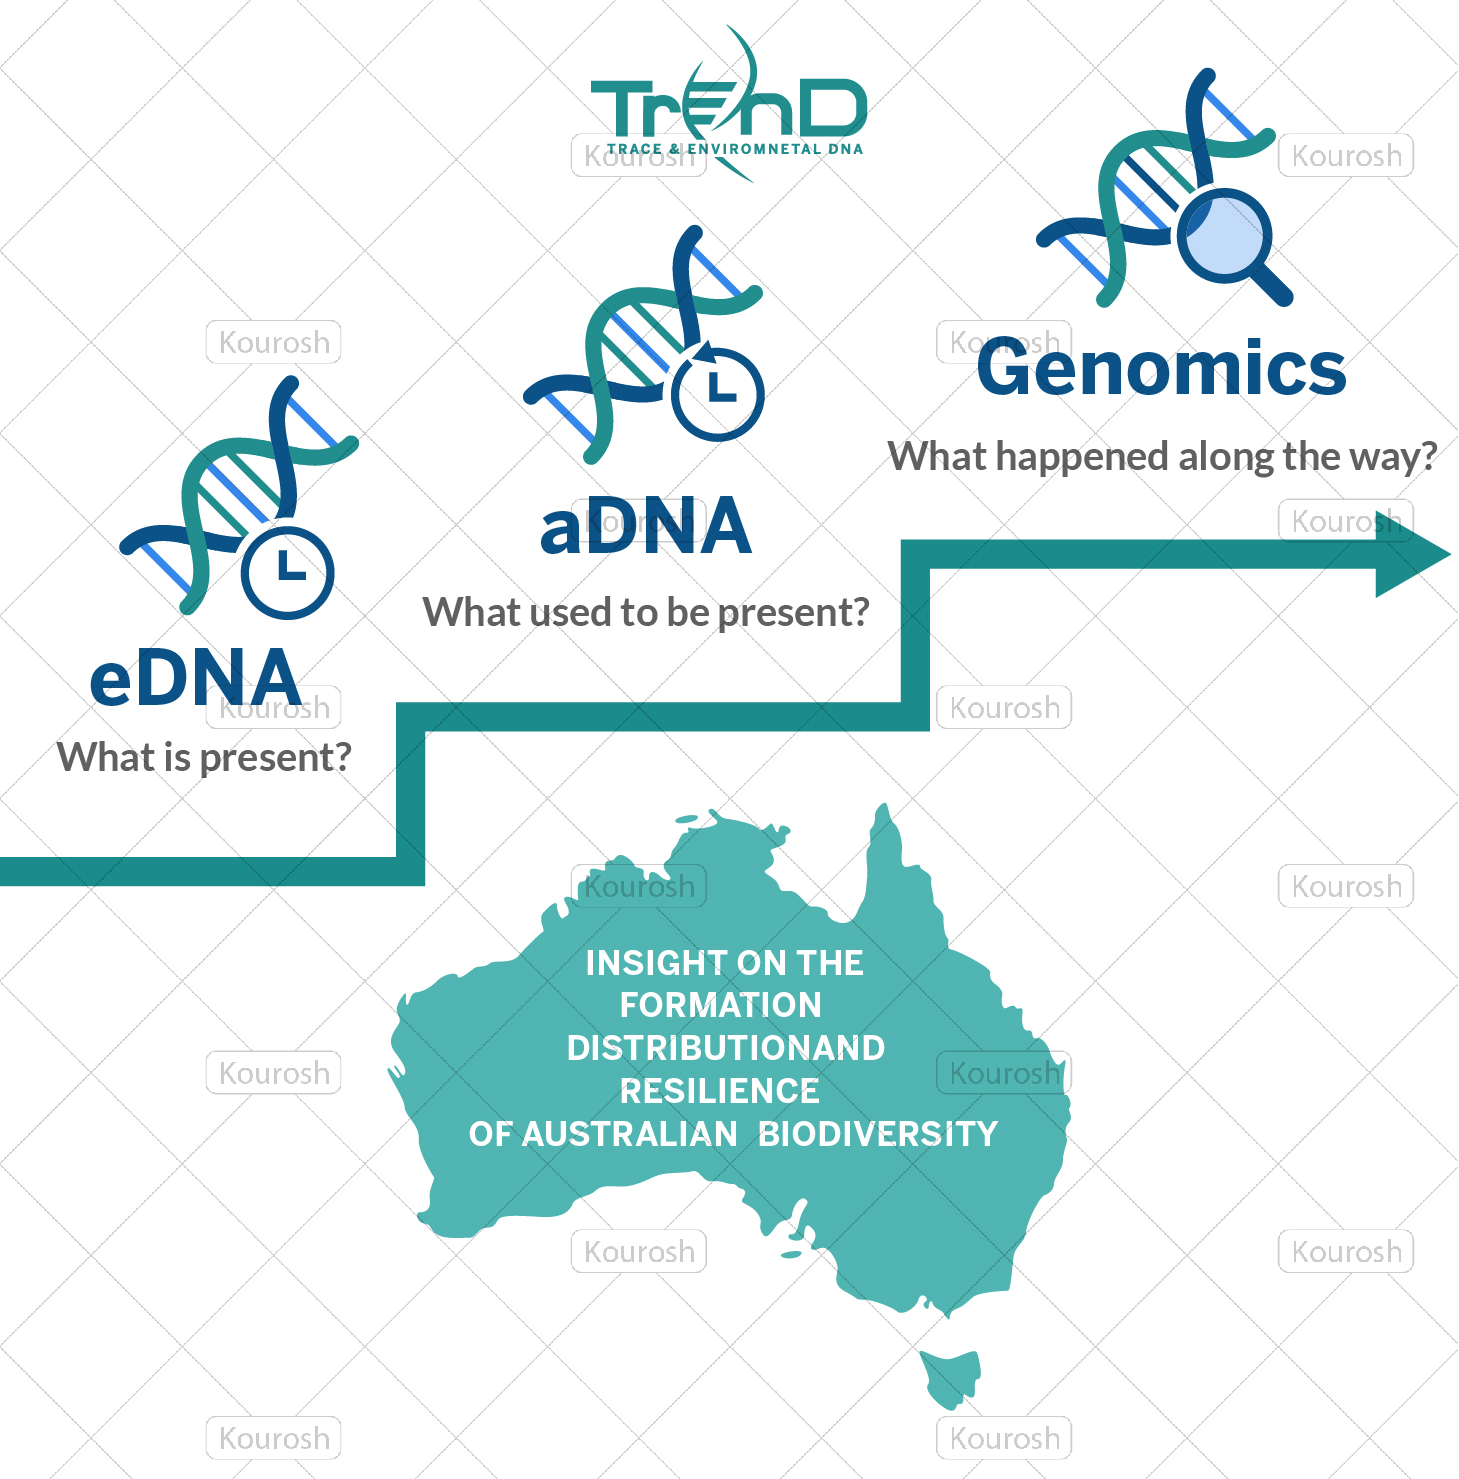
Gaphic explaining connectivity of research areas that use DNA analysis
Want to win a job like this?
This customer received 15 graphic designs from 6 designers. They chose this graphic design from kourosh as the winning design.
Join for free Find Design Jobs-
 A$100
A$100
-
 15 designs
-
 6 designers
Graphic Design Brief
We are a university research group in Perth Western Australia focused on ecology and environment fields. Our work can be explained by three broad areas where its applied - what used to be present ('ancient DNA analysis'), what is present now ('environmental DNA analysis') and what happened in terms of DNA based changes in between ('genomic changes'). To help simply convey this to other researchers and importantly non-science-savvy people we wanted an a eye catching rework of the attached for our website, future presentations, brochures etc. We didn't want it too visually complicated, nor wordy so something akin to the attached with a better look will help . More background on each point can be read on the website under construction here - https://scieng.curtin.edu.au/trend-lab/
Target Market(s)
other science researchers in ecology, environment, geology, forensics areas, although ultimately its meant to be a simple way to understand for all people
Font styles to use
Requirements
Must have
- the three areas indicated
Should not have
- design does not need to follow the colour pallet of the university (ie poo brown and black)