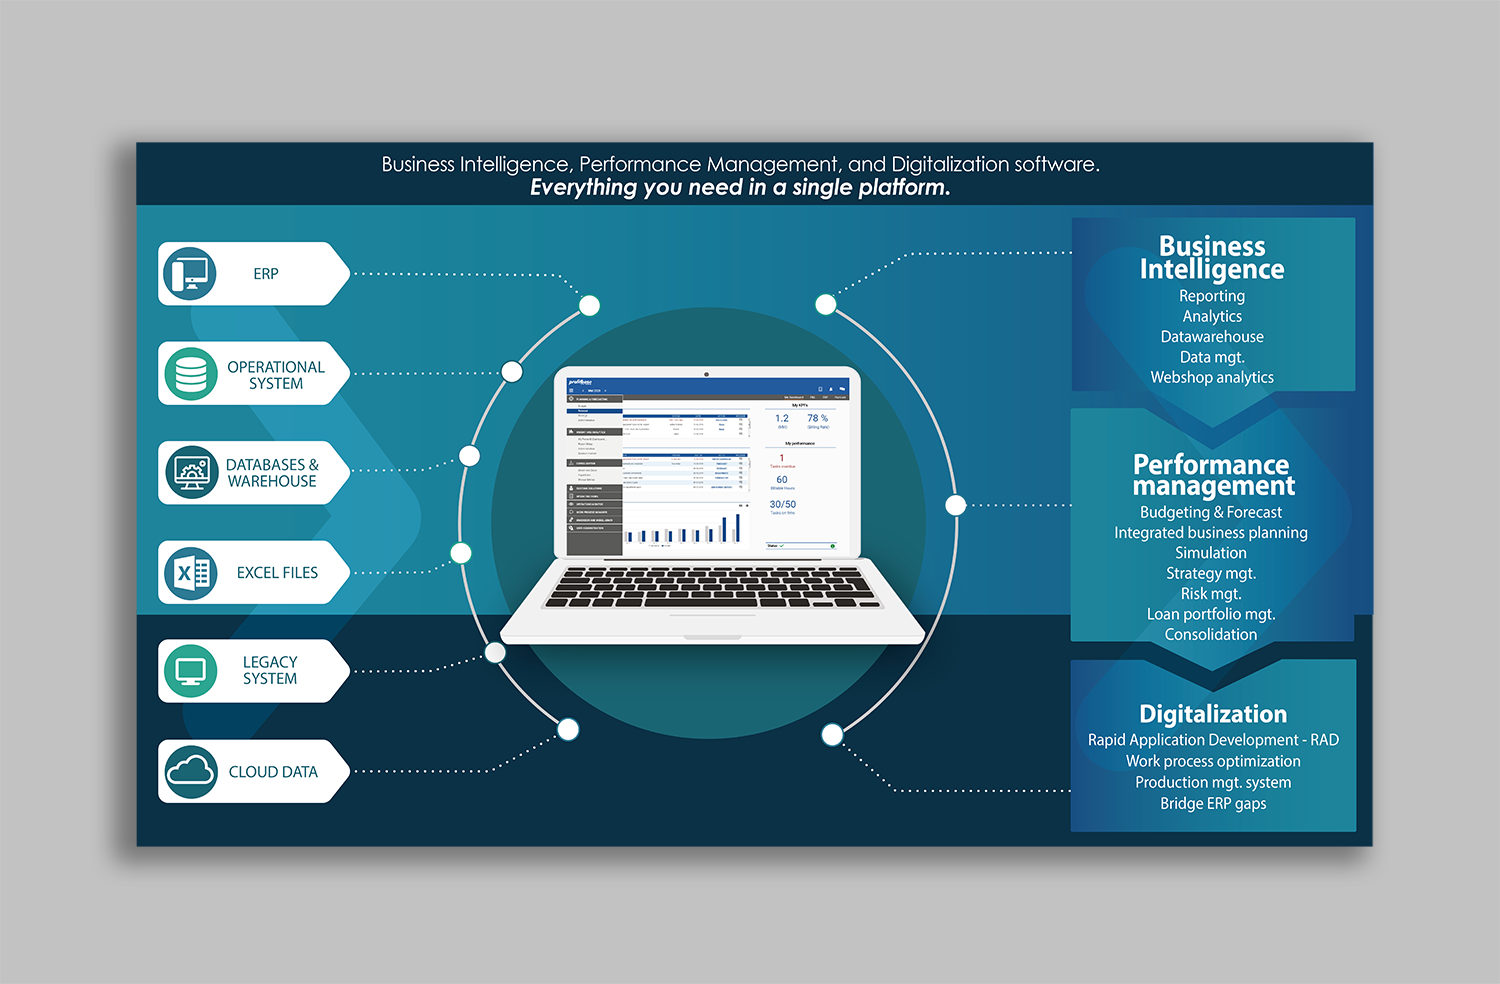
Graphic that illustrates how we create insight from data
Want to win a job like this?
This customer received 21 graphic designs from 9 designers. They chose this graphic design from IndreDesign as the winning design.
Join for free Find Design Jobs- Guaranteed
-
 US$110
-
 21 designs
-
 9 designers
Graphic Design Brief
We need a graphic that in the one end contains a list of various data sources and in the other, we see our company's three main areas.
so, three main elements in the graphic:
1. the different sources
2. a screen in the middle
3. at the end a list over our main areas.
IMPORTANT MESSAGE: Do not make the design too SIMILAR to the one in the powerpoint - we want something that's in the same street. Use your artistic talents. Make something new. The picture I attached is borrowed from another company. It's there for directions.
Attach alongside the design suggestion: a description of the format you suggest for the graphic.
- We need the graphic to be in a format that we can edit easily so that we can make translations and changes.
Use similar colors as I show in the PowerPoint.
On
Look and feel
Each slider illustrates characteristics of the customer's brand and the style your logo design should communicate.