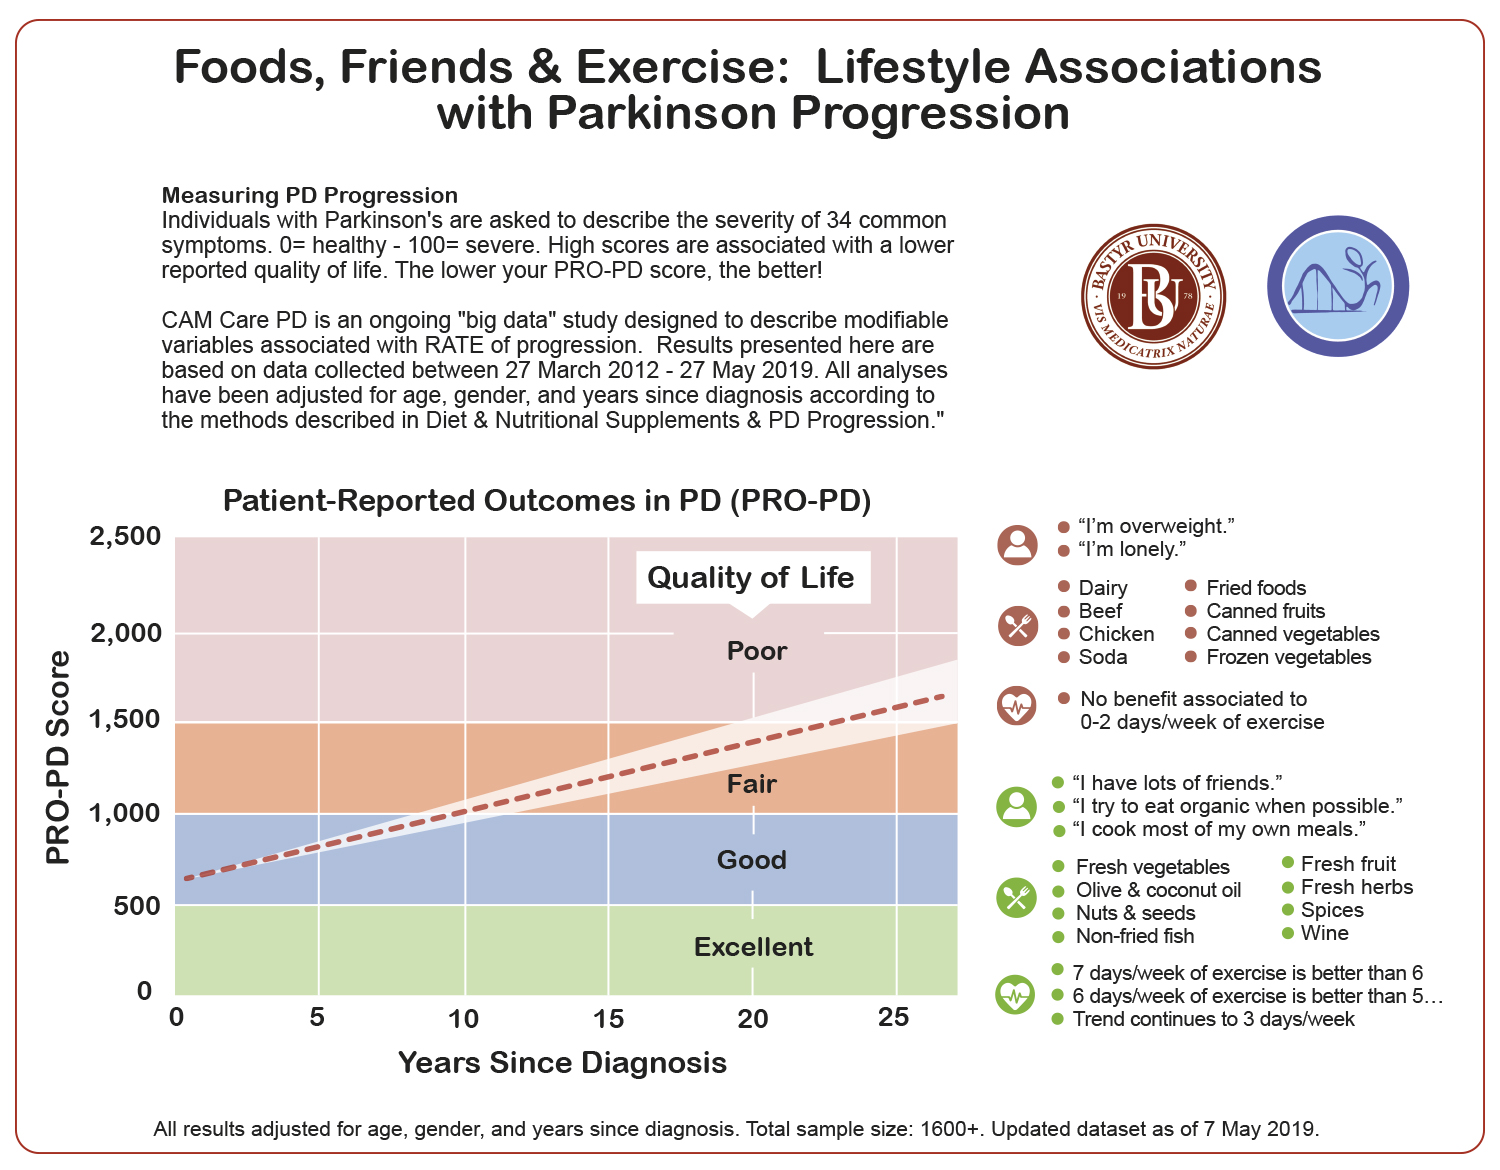
Diet, Exercise, & Friends are Associated with Parkinson's disease Progression
Want to win a job like this?
This customer received 33 infographic designs from 11 designers. They chose this infographic design from aloysioxavier as the winning design.
Join for free Find Design Jobs- Guaranteed
-
 US$190
-
 33 designs
-
 11 designers
Infographic Design Brief
We are researchers looking for modifiable variables associated with different rates of Parkinson's disease (PD) progression. This is a novel scale: www.PROPD.org -- higher scores are associated with worse quality of life. Low is good. High is bad. Each of the dots is a real person (maybe those should disappear?). The line represents the typical rate of PD progression over time. Color scheme of different degrees of quality of life can change, but the general concept seems to be working. (see updated version at the bottom of the www.PROPD.org website)We need to combine the exercise data from here. This poster was essentially my attempt at an infographic for scientists:https://static1.squarespace.com/static/5919381af7e0ab8d479df4b4/t/5942387403596e8a651c57c5/1497512054713/MDS2017+Diet.pdf. The updated data is in the uploaded figure below. Please use this list/ verbage!I don't necessarily need to stick to red=bad, green=good, but that's the best I've been able to come up with to communicate all this. I can get the actual data output later, but it might be nice to be able to demonstrate intensity. Veggies are quite a bit better than spices. Loneliness is much, much worse than pasta. This is the original published data. We have updated data and want to turn it into an infographic (while we work on a new manuscript).https://www.hindawi.com/journals/omcl/2017/6405278/
Updates
Low designer entries
Target Market(s)
Individuals age 40-80 with Parkinson's disease (and their friends & family members).
Neurologists should be handing this out in their offices.
When patients ask their physician about nutrition, etc., we want this to be the 1-pg handout they give them.
Industry/Entity Type
Medicine
Font styles to use
Colors
Designer to choose colors to be used in the design.
Look and feel
Each slider illustrates characteristics of the customer's brand and the style your logo design should communicate.
Elegant
Bold
Playful
Serious
Traditional
Modern
Personable
Professional
Feminine
Masculine
Colorful
Conservative
Economical
Upmarket
Requirements
Must have
- PRO-PD scale (www.PROPD.org)-- use this picture on top. OK to change color.
- Lists foods/ activities associated with different rates of progression
- Title: "Food, Friends, and Exercise: Lifestyle Associations with PD Progression"
- Legend/ disclaimer (smaller font):
- "All results were adjusted for age, gender, and years since diagnosis. Total sample size: 1600+
- Based on the methods described in publication: "Role of Diet and Nutritional Supplements in PD Progression" [Mischley LK et al, Oxid Med Cell Longev 2017], an updated analysis was performed on data on 7 May 2019. (N >1600)"
- "PRO-PD scores available at www.PROPD.org"
- Must fit on a single 8.5 x 11" page.
Nice to have
- The background should be white-- I want neurologists/ physicians downloading it, printing it, and distributing to patients. I don't want to waste ink.
- Logo for Bastyr University and/or the logo for the "CAM Care PD" Study. I like the BU emblem in one corner and the picture at the top of this website: www.PROPD.org
- Would be nice if it could be understood between cultures and/ or easily translated.
- Would be nice if we could invite people to participate in the study!
- "To learn about joining the study, please to www.CAMCarePD.bastyr.edu"
Should not have
- Pictures of overweight people, or the impression that a muscular white guy is the ideal. I want to leave room for diversity and flexible interpretation.
- Too much text- a good-sized portion of this group will have poor vision and/or dementia. Needs to be simple.
- I like the simplicity of "Good" and "Bad"... don't love the labels. Seems to 'jugdgy'. Maybe "Encourage" and "Avoid" OR "Positive" and "Negative"