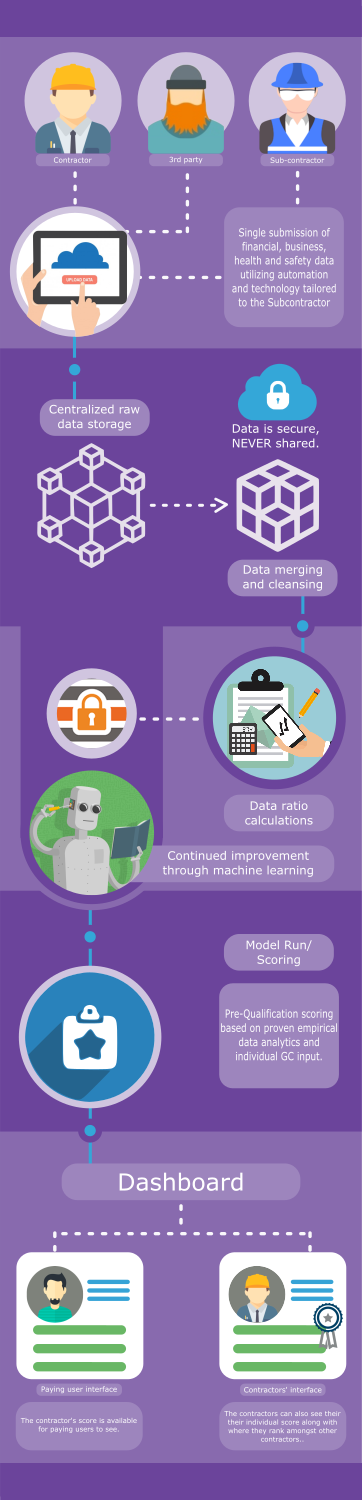
Data Flow Illustrative Diagram
Want to win a job like this?
This customer received 8 graphic designs from 6 designers. They chose this graphic design from ankitagraphics as the winning design.
Join for free Find Design Jobs- Guaranteed
-
 C$140
C$140
-
 8 designs
-
 6 designers
Graphic Design Brief
We'd like an illustrative diagram for a data product we are developing. The product is based in the construction industry and is a rating system for contractros.
We want to illustrate a number of states in the process.
1. Data Collection
- We have an online interface in which contractors can upload their data in multiple formats.
- Data is also collected from third party data feeds
- All Data is stored in a centralized database
2. Data Cleansing and Merging
- The collected data from all sources is cleansed and merged together
- Need to highlight that this data is secure and never shared
3. Data Prep/Ratio Calculation
- The data is then manipulated to show and prepared for a run through a financial model
- Again, need to indicate that the orginal RAW data collected in 1 and 2 is never shared
4. Model Run / Scoring
We run financial models on the data produced in Stage 3 to generate a "score/grade" for the individual contractors
5a. Dashboard - Paying Users
The contractor "score/grade" from 4 is available on a dashboard for paying users to see
5b. Dashboard - contractors
The contractor can also log into a dashboard to see their individual score along with where they rank amongst other contractors.
6. We gather contractor project review information and feed it into the model the the Dashboard/interface
7. Machine Learning / Artificial Intelligence
- We need another component off of Stage 3/4 that indicates we are running machine learning algorithms on the data to produce constantly improving results.
This illustrative diagram will be shown to contractors as well as technical companies so it should be clear and easy to understand.
Our website/company colours are purple (accented with blue).
See the two attached diagrams for very basic ideas of the flow. We'd like something much more polished and professional but extremely easy to understand.
Updates
Project Deadline Extended
Reason: Extending 5 days and guaranteeing payment
Added Saturday, December 10, 2016
Extending the deadline and guaranteeing the project.
- Please note that I'm looking to show a flow of data moving through a system. Not simply an itemized list
- This is in the construction industry and should reflect that.
- IMPORTANT TO HIGHLIGHT: This is a centralized database for the industry. Data is collected from multiple sources and stored in a secure central location.
Added Saturday, December 10, 2016
Target Market(s)
Construction Industry
Industry/Entity Type
Construction
Font styles to use
Colors
Colors selected by the customer to be used in the logo design:
Look and feel
Each slider illustrates characteristics of the customer's brand and the style your logo design should communicate.